LEIP is a project conceived by the Ministry of Housing and Urban Affairs as a part of the India Smart Cities Fellowship programme. The platform aggregates and analyses data at the local level to provide economic intelligence to the administrators, researchers and investors. LEIP uses an in-house developed Local Economic Development framework to understand where the local economy stands and places the city on a four-pillar axes. This is based on an index score calculated from 100 indicators of the framework. The platform will have a Rapid Economic Assessment of the economy based on the four pillars. It will identify the comparative and competitive advantage of the local economy through location quotient and shift share analysis. Based on this analysis the platform will provide economic intelligence to the urban authorities, that is, identify the gaps in the ecosystem of the economy and give direction for intervention. The platform will also do cluster mapping and cluster analysis by identifying the forward and backward linkages of different sectors of the economy and thereby provide insights about sectors with growth potential.


Rapid Economic Assessment (REA)
Analysis of the economic ecosystem of the city along the four pillars of the economy: human capital, investment, infrastructure and policy variables. REA will show where the local economy stands in terms of the stronger and weaker pillars of the urban economy.
Comparative and Competitive Advantage
Sectoral analysis and identification of sectors that have comparative and competitive advantage in the city economy. This section provides information on which sectors are viable for growth and why in the urban economy.
Cluster Analysis
Using data for establishments and transactions, this section visualizes the spatial distribution of the economic activities. Further, sectoral analysis will be done to identify the forward backward linkages in the economy.
Economic Intelligence
Economic Intelligence provides information on the economic ecosystem gaps and a direction for intervention for selected sectors, exclusively for city authorities.
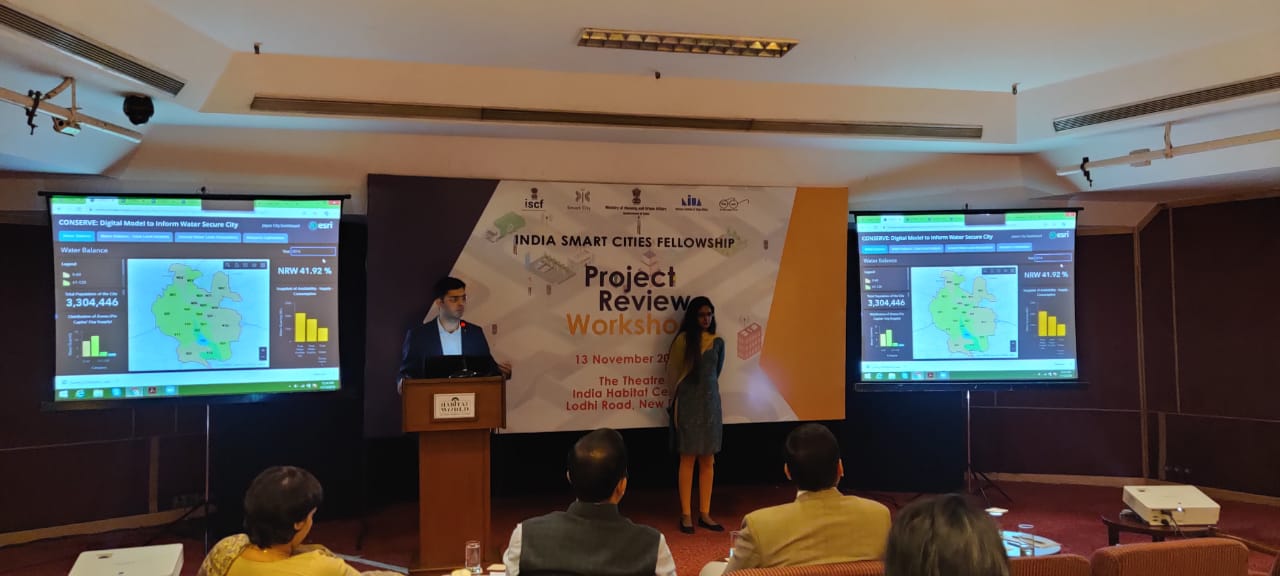
Conserve- Digital Model to inform Water Secure Cities, can be of great use for PHED as it gives a lot of information regarding water production, distribution, conservation (both as rain water harvesting and traditional usage pattern) and quality.It also shows the water stressed areas in the city, where attention is needed to improve water supply, and areas from where water can be saved by reducing Non Revenue Water(NRW) up to international standards. It will also be helpful for advance monitoring and can provide a foundation for advanced applications (Digital Utility) regarding water sensitive urban design of the city.


The significance of this tool cannot be over-emphasized. Indian cities are facing a water crisis and the first step in addressing the crisis is to have a robust database on the water budget of the city. This tool is a wonderful step in that direction. While this tool has been developed for the city Jaipur, it has tremendous potential to be scaled up to the other cities in India as well. In this digital age, information is king. Tools such as these will go a long way in providing city officials and administrators with just the kind of information required to make informed choices on the relevant interventions to be rolled out for achieving water security.

Mentor
Mentor

Team Lead
Team Lead

Team Lead


The challenge of water security in Indian cities has been a daunting one, with millions of people lacking access to potable water. This was realised early on in the brainstorming sessions of the India Smart Cities Fellowship and the team decided to develop a smart solution to solve this challenge. The multifaceted problem of water security was studied meticulously, with continuous guidance and support from mentors and experts from SCM, MoHUA, NWM, CGWB, IIT Delhi, TERI, CII-TWI, NMCG, and many more. It was identified that the current situation was a result of poor management of water resources, which also gave rise to issues like inefficient and unequal distribution of water, over exploitation of water resources, inadequacy of capital and human resources for operation and maintenance, and many more. The team concluded that the lack of an integrated data platform is a major impediment in understanding the complexity of the system, and consequently, inhibiting the progress towards achieving water security.
Hence, Conserve: Bits and Drops of Water was conceptualised as a decision support tool which would integrate data, otherwise resting in silos, to create a clearer picture of the complex system. The goal of the tool was to aid smart cities in achieving water security, with water conservation being at the heart of the solution.
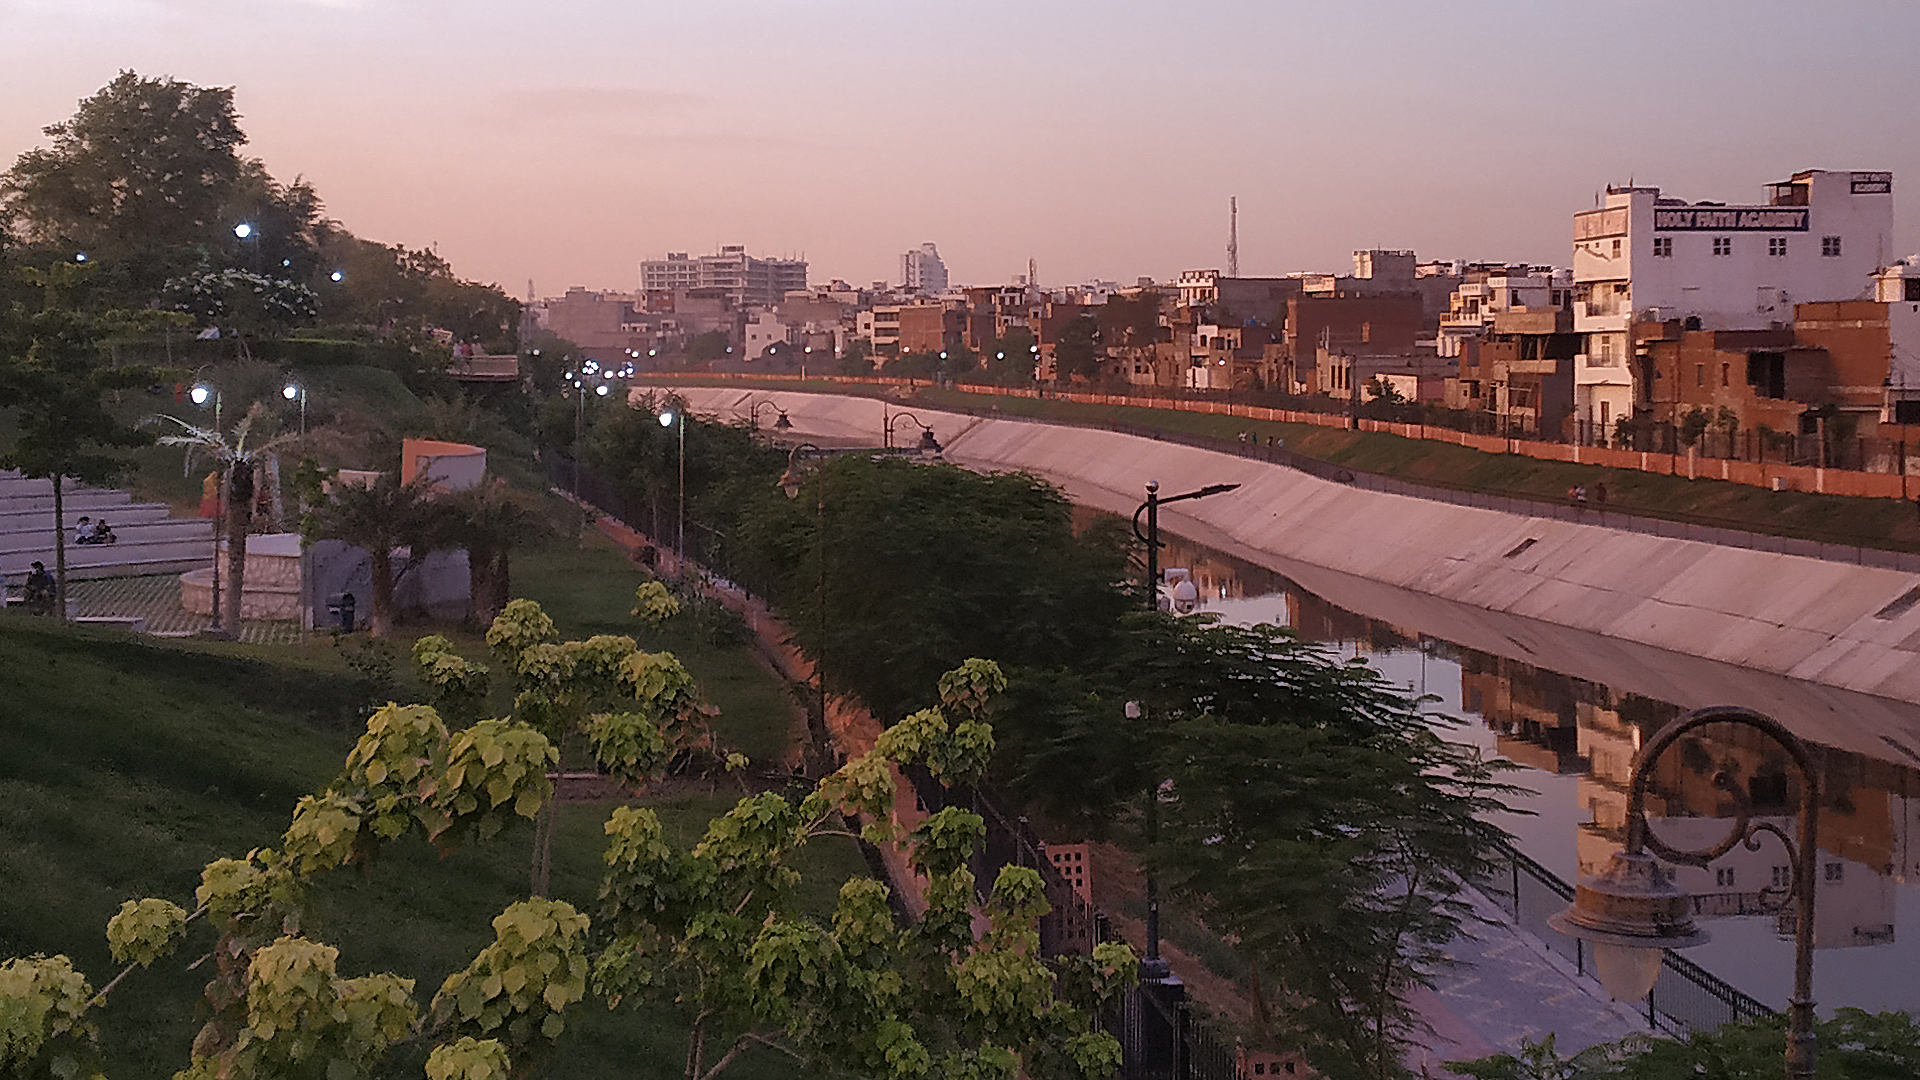
Thorough study of various smart cities against criteria like present state of water security, data availability, projected growth and scale of the city resulted in shortlisting the cities of Varanasi and Jaipur for project pilot. To understand the challenges in detail, field trips to both the cities were made. With support from Varanasi Smart City Ltd. and Jaipur Smart City Ltd. workshops and presentations were conducted with various city and state level stakeholders to firstly convey the project idea and secondly, to understand the on-ground conditions from local experts. After the review of field trip research and analysis by project mentors and MoHUA team, Jaipur was finalised for pilot development of the tool.
The inherent complexity of the urban water system can be attributed to data resting in silos with multitude of agencies. To avoid such a situation, detailed consultations were held with every stakeholder ranging from Municipal Corporation (MC) and Public Health Engineering Department(PHED) to Rajasthan Groundwater Department and Department of IT and Communication (DoIT&C) for data sharing.
The tool development was initiated under the guidance of MoHUA leadership and technical experts from NIUA and India Urban Observatory. Statistical data of water supply & consumption, groundwater & surface water resources, population, water connections, etc were standardised using methods prescribed by CPHEEO. Subsequently, the data model of the tool was developed in consultation with the project mentor after data refinement. Two major challenges encountered during this process were, a) non-concurrence of water supply & consumption data, surface water data, groundwater data; b) incongruity of water supply, connections and population data. Both of these issues were tackled using statistics and spatial analytics, respectively. The user interface of the tool was sketched out by simulating use cases for various prospective users. Esri’s ArcGIS Online and Operations Dashboards were used to create the tool, due to its powerful statistical and spatial capabilities.
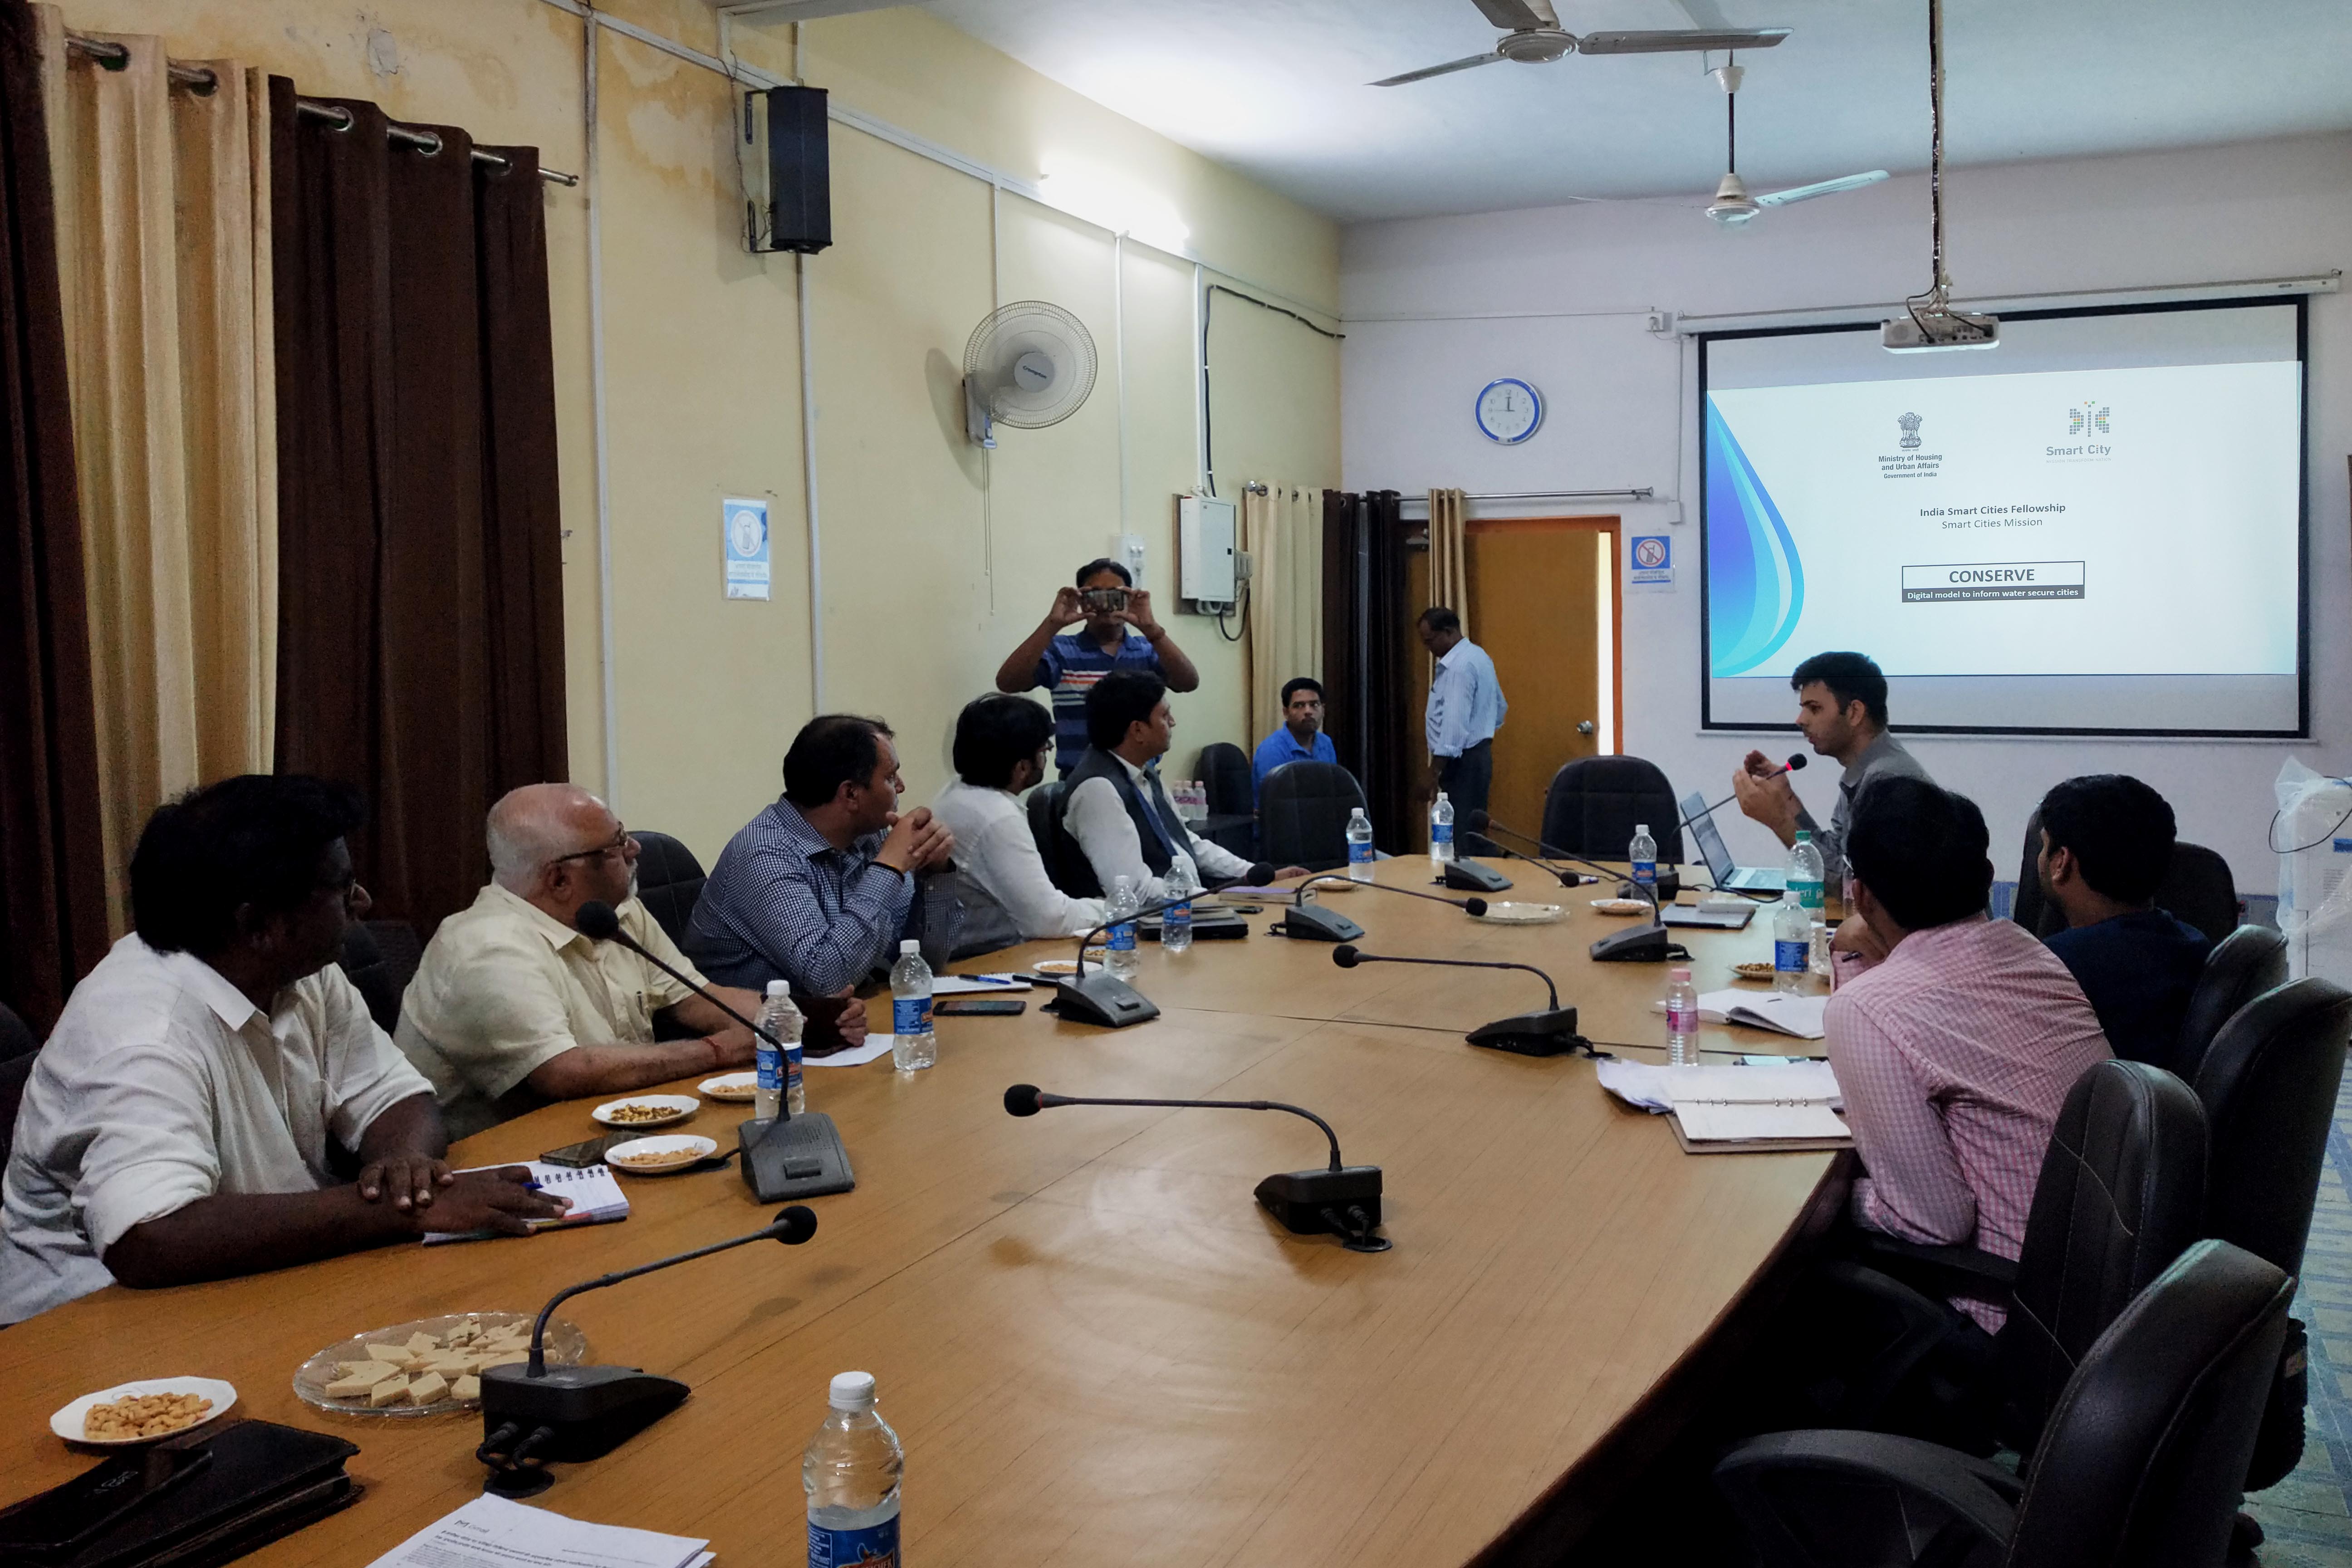
The tool was tested in the city with support from PHED and MC engineers. Their responses and suggestions were combined with inferences from data to create insights for the city. Various indicators for assessing the situation of a water supply zone, like growth of demand-consumption deficit and persons served per water connection were created and published in the tool. After discussing the need of a sustainable solution for achieving water security, the rainfall and GIS data for every building in the city was integrated to create a handy tool for calculating the potential of rooftop rainwater harvesting. It was designed in a manner so as to be used by a city manager as well as a citizen. The technology and data model were standardised to ensure easy adoption across other cities.